November 2nd 2024
It’s seen every week in football, whether it be in the Premier League or Sunday League. A ball goes out for a throw-in, and slowly but surely, the thrower inches their way up the line, stealing metres that in the grand scheme of things, don’t really matter. However, who is the biggest serial offender of this? Which teams consistently steal the most metres per throw-in? I’m sure these are questions that each and every one of you are just dying to have answered.
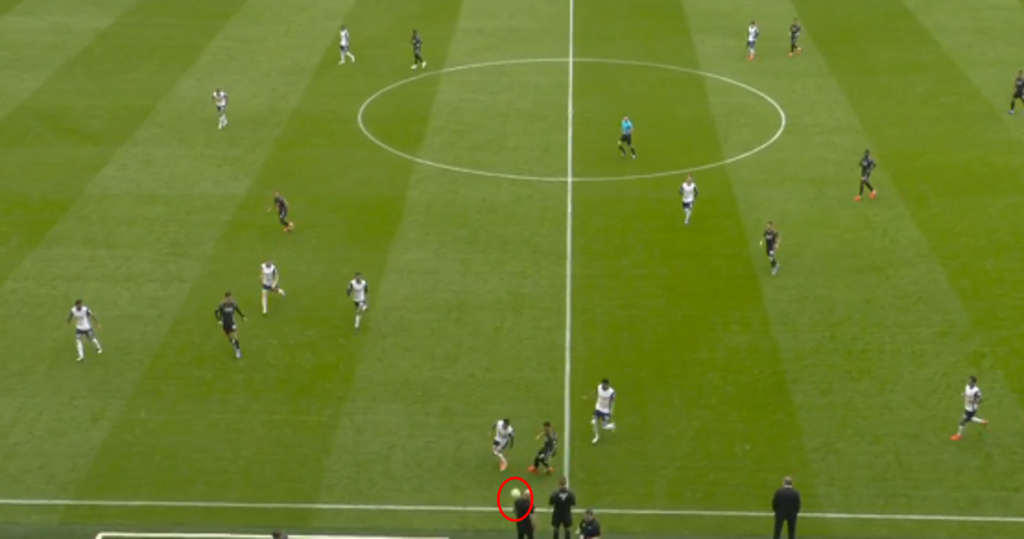
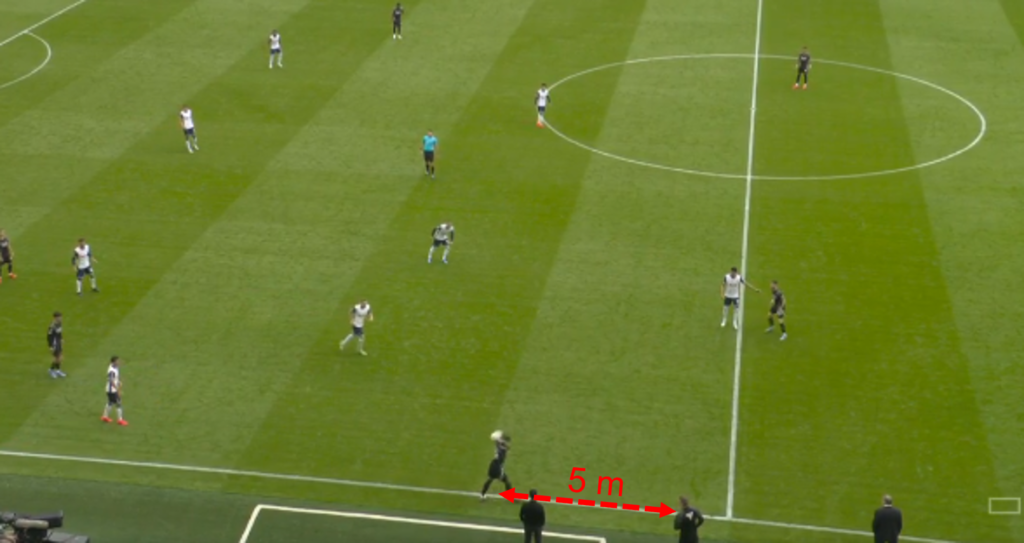
In this article, I’m going to describe the process used to calculate the metres stolen for throw-ins. This process begins with finding the events that occurred before each throw-in, then finding end locations of these events, and then calculating the metres stolen per throw. Using this dataset of throw-ins, an interactive Power BI report showing the overview of all the stolen metres is created.
If you would like to jump ahead to seeing/using this Power BI report, feel free to skip to the Section 5 below. Firstly, however, it is important to note where the data comes from for this report.
Skip to different sections
1) The Data
2) Finding events before throw-ins
a) Opta: Out events
b) Statsbomb: Unsuccessful pass events
3) Cleaning data and calculating metres stolen
a) Statsbomb: Calculating metres stolen
b) Opta: Calculating metres stolen
4) How to use the Power BI report
5) Power BI report
1) The Data
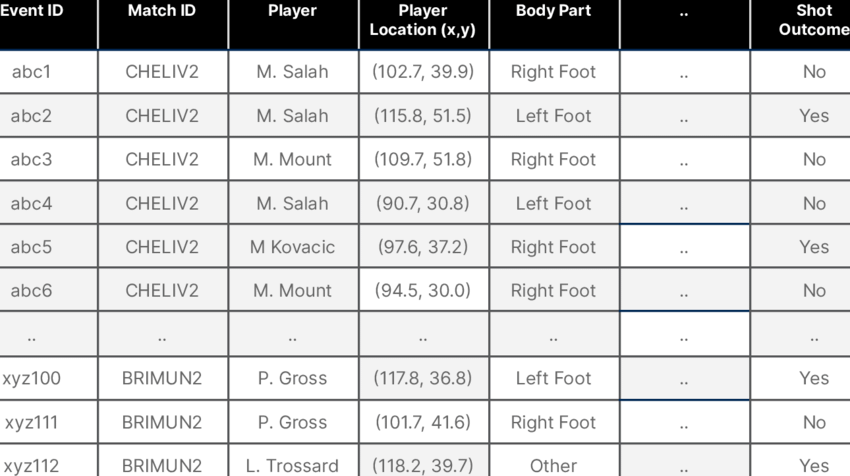
I would like to give a big shoutout to Statsbomb (SB) (now Hudl Statsbomb) for providing such a vast amount of football event data for free. The vast majority of the data used in the below Power BI report comes from them. If you’re interested in using their open datasets, you can find more information here. Alongside the SB open datasets, I have also kindly been allowed to use some Opta event data from the Danish SuperLiga during the 2020/21 season. For this, I would like to thank the Danish Football Association (DBU) for allowing me access to this data, which I also used as part of my master’s thesis in 2022, where I analysed passing sequences leading to goal-scoring opportunities.
As a way of pre-processing these two data sources, I have set-up my own SQL database and created Python scripts to extract data from the SB API and the raw Opta XML files and store the data in my database. I have then created a relational database, integrating the SB and Opta events together. I hope to write an article in the future about how I created this database and the scripts used to load the data into the database, if there is a demand. If you would like to learn more about how Opta event data is created, click here, and if you would like to learn more about how SB create their event data, click here.
As of the time of writing, there are approximately 300,000 Opta events and 12,080,000 SB events in my database.
2) Finding events before throw-ins
In order to determine how many metres a player steals during a throw-in, we need two details:
- The location where the ball went out of play.
- The location of where the ball was thrown from.
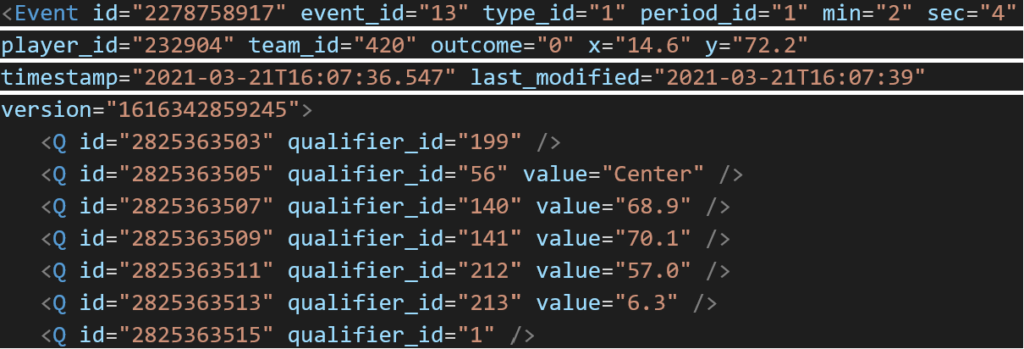
The latter is very easy to determine, as both Opta and SB have precise(ish) locations for where all passes are located, and throw-ins are simply a subset of passes. The former, however, is not so simple.
In order to determine where the ball went out of play, we need to look at end locations of the events that occurred just before the throw-ins. Due to the differences in event types between Opta and SB, two different approaches need to be used to determine the correct event before each throw-in. Firstly, let’s start with Opta events.
a) Opta: Out events
A nice thing about using Opta event data for this analysis is that Opta have an event type called ‘Out’. Any time the ball goes out of play, two ‘Out’ events are created, one for each team. Thus, for the dataset for Opta throw-ins, all throw-ins are included, along with any ‘Out’ events that occurred within the 3 events preceding a the throw-in (Note: The reason we look at all 3 events before the throw-in is because it is possible for other events to occur between the ball going out of play and the throw being taken E.g. An injury or a substitution).
A snippet of how the Opta throw-ins dataframe looks can be seen below.
| dim_competition_id | dim_game_id | dim_gamedate_id | dim_team_id | dim_player_id | dim_event_id | opta_event_index | minute | second | player_position | player_shirt_number | event_outcome | x_coord | y_coord | event_timestamp | period_id | pass_end_x_coord | pass_end_y_coord | pass_length | pass_throw_in | pass_xA |
|---|---|---|---|---|---|---|---|---|---|---|---|---|---|---|---|---|---|---|---|---|
| 72 | 1 | 20200921 | 67 | 5085 | 46 | 22 | 00 | 52 | Goalkeeper | 1 | 1 | 3.2 | 100.8 | 2020-09-21 18:03:12.7970000 | 1 | -1 | -1 | -1 | 0′ | -1 |
| 72 | 1 | 20200921 | 67 | 4290 | 37 | 23 | 1 | 12 | Defender | 5 | 1 | 6.5 | 100.7 | 2020-09-21 18:03:32.8780000 | 1 | 24.3 | 97.2 | 18.8 | 1 | 0.00000023 |
| 72 | 1 | 20200921 | 67 | 4291 | 46 | 34 | 1 | 19 | Striker | 79 | 1 | 10.7 | 100.8 | 2020-09-21 18:03:39.5480000 | 1 | -1 | -1 | -1 | 0′ | -1 |
| 72 | 1 | 20200921 | 67 | 4290 | 37 | 35 | 1 | 28 | Defender | 5 | 1 | 13.9 | 100.8 | 2020-09-21 18:03:48.6110000 | 1 | 13.6 | 86.3 | 9.9 | 1 | 0.00000015 |
| 72 | 1 | 20200921 | 65 | 4128 | 46 | 98 | 4 | 07 | Midfielder | 2 | 1 | 38.7 | -0.8 | 2020-09-21 18:06:27.5410000 | 1 | -1 | -1 | -1 | 0′ | -1 |
Snippet from table Fact.Opta_Throw_Ins.
It should be noted that this method is not perfect for assigning an ‘Out’ event with every throw-in due to errors in the data and the fact that the ‘Out’ event could be the fourth event (or more) preceding the throw-in (The threshold was set at 3 as it was taking too long to generate the dataset with more).
However, as of the time of writing 7,843 out of 8,298 (95%) Opta throw-ins link correctly to an ‘Out’ event.
b) Statsbomb: Unsuccessful pass events
Unlike Opta, SB do not have a specific event type for when the ball goes out of play, making the task of finding where the ball went out a bit more difficult.
Looking into the SB event data, there is a qualifier ‘Out’ that indicates if an event caused the ball to go out of play. However, after investigating the different events with this qualifier that occurred before throw-ins, it became clear that the precise location where the ball went out of play cannot be determined for many of these events. For example, interception events only have a location where the ball was intercepted, not where it went out of play, clearances are the same, as are ball receipts. The only event that was found to have precise(ish) locations where the ball went out of play was for unsuccessful passes.
For all SB pass events, there are x and y locations for where the pass ended. Thus, to find the location where the ball went out of play, we look at unsuccessful pass events along the sideline just before throw-ins. Again, we look at the 3 events preceding each throw-in.
A snippet of how the SB throw-ins dataframe looks can be seen below.
| dim_competition_id | dim_game_id | dim_gamedate_id | dim_team_id | dim_player_id | dim_event_id | sb_event_index | minute | second | player_position | pass_outcome | x_coord | y_coord | event_timestamp | period_id | pass_end_x_coord | pass_end_y_coord | pass_length | pass_type |
|---|---|---|---|---|---|---|---|---|---|---|---|---|---|---|---|---|---|---|
| 56 | 17 | 20221021 | 236 | 5264 | 69 | 621 | 15 | 08 | Left Center Midfield | Out | 78.1 | 20.2 | 2022-10-21 21:15:08.3050000 | 1 | 77 | 0.1 | 20.130077 | N/A |
| 56 | 17 | 20221021 | 66 | 7861 | 69 | 623 | 15 | 13 | Right Back | N/A | 42.8 | 80 | 2022-10-21 21:15:13.7700000 | 1 | 49.6 | 72.4 | 10.198039 | Throw-in |
| 56 | 17 | 20221021 | 66 | 4887 | 69 | 646 | 15 | 44 | Left Midfield | N/A | 106 | 0.1 | 2022-10-21 21:15:44.9290000 | 1 | 83.2 | 8.9 | 24.439312 | Throw-in |
| 56 | 17 | 20221021 | 66 | 7605 | 69 | 929 | 26 | 07 | Left Defensive Midfield | Out | 52.3 | 43.3 | 2022-10-21 21:26:07.8600000 | 1 | 100 | 80 | 60.18455 | N/A |
| 56 | 17 | 20221021 | 236 | 2483 | 69 | 931 | 26 | 27 | Left Back | N/A | 20.1 | 0.1 | 2022-10-21 21:26:27.3680000 | 1 | 15.7 | 7.5 | 8.609298 | Throw-in |
Snippet from table Fact.SB_Throw_Ins.
Since unsuccessful passes before throw-ins are the only events that show the location of the ball going out of play, there are a number of SB throw-ins where the number of metres stolen cannot be determined. For example, the third row in the table snippet above is a throw-in that was not caused by an unsuccessful pass, so there is no ‘pair’ event for this throw, showing where the ball went out of play.
As of the time of writing only 59,928 out of 155,928 (38%) SB throw-ins can be used for calculating metres stolen due to this.
Now that we have successfully built our two throw-in datasets, we can move onto calculating the metres stolen per throw and combining the two datasets into one for the final PowerBI report.
3) Cleaning data and calculating metres stolen
Once the two datasets are created in SQL, the next step taken is to clean the datasets and use the events to calculate each throw-in’s metres stolen.
To do this, we write a Python script. If you are curious in seeing the whole Python script, you can find the Github repository here. The script described in this section refers to the file ‘Update_Fact.Throw_Ins’.
With the way we set-up our two datasets, finding the throw-ins and the three events just before them, there can be some rows in the datasets that are unnecessary. For example, when creating the SB dataset, if the two events just before a throw-in were both unsuccessful passes along the sideline, then they will both be included in our dataset. However, we only actually need to include the event right before the throw-in and not the one before that. The same can also be said if somehow all three events just before a throw-in are all unsuccessful passes along the sideline. A visual representation of the events we keep and those we delete can be seen below.

The same thought-process is applied to the Opta dataframe and unneccessary ‘Out’ events are filtered out too.
Now that we have ensured that every throw-in is linked to exactly one event preceding it (or zero if the throw-in has no ‘pair’ event), we can calculate the metres stolen for these throw-ins.
However, due to the nature of the two datasets, we need to use two slightly different methods to calculate the metres stolen for Opta and SB. Let’s start with SB.
a) Statsbomb: Calculating metres stolen
The events that precede throw-ins for SB are unsuccessful passes. This means that there are two cases to deal with, either the team that is to take the throw-in made the preceding pass and it was deflected/blocked out of play, or the other team made an unsuccessful pass out of play.
For the first case, it is very easy to calculate the metres stolen, simply by subtracting the end x-coordinate of the unsuccessful from the x-coordinate of the throw-in pass. The dimensions of the SB pitch are 120×80, and an example for calculating the metres stolen for a deflected/blocked pass throw-in can be seen below.
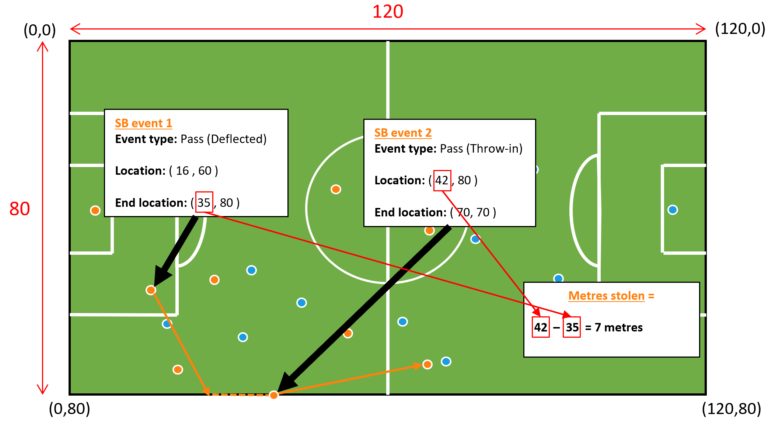
The other case, when the pass preceding the throw-in is put straight out of play, is a little bit trickier to calculate.
The way SB (and Opta) pitch coordinates work, is that the team in possession of the ball is always attacking from left to right, meaning that when the ball changes possession, the player and ball coordinates invert. For example, if the team in possession are in their own half (left side of pitch) and give the ball away, then the team gaining possession are in the opposing half (right side of the pitch).
Thus, for throw-in events when the ball is changing possession, the pitch coordinates invert, and the calculation for metres stolen needs to be adjusted slightly. An illustration of this can be seen below.
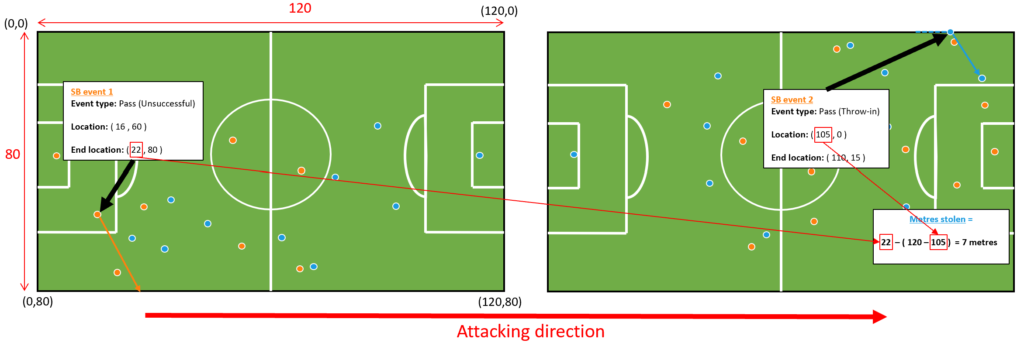
Left: Orange team pass ball out of play in their own half.
Right: Blue team take throw-in in attacking half.
Using these two very similar calculations, we calculate the metres stolen for SB throw-ins in our dataset. Finally, we calculate the same for Opta throw-ins.
b) Opta: Calculating metres stolen
The nice thing about Opta ‘Out’ events is that there are always two events, one for each team. Because of this, we don’t need to worry about the pitch coordinates inverting, as the only ‘Out’ events we include, are those that are for the team taking the throw-in. Thus, the calculation is the exact same as for SB throw-ins where the pass was deflected/blocked out before.
However, there is a slight difference in pitch dimensions for Opta and SB, with Opta being a 100×100 pitch. So, in order to keep consistency across the two data sources, we need to convert the metres stolen for Opta throw-ins to be the same as SB throw-ins. Thus, since the SB pitch is 120 in length, we simply multiply the Opta metres stolen by 120/100. A visual representation of calculating the metres stolen for Opta throw-ins can be seen below.
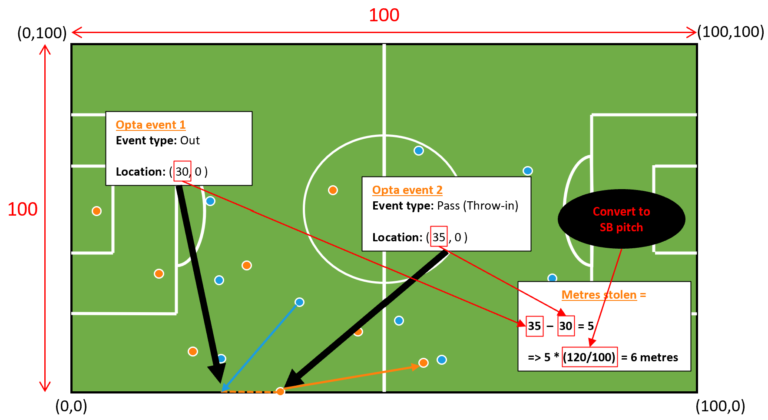
Once a new column has been added to each dataset with the metres stolen for each throw-in, all that’s left to do is to merge the two datasets together and store the merged table in our SQL database. Once the final dataset is made, the Power BI report below is created.
The next section shows a YouTube video giving a walkthrough on what can be found in the report and how to use it.
4) How to use the Power BI report
5) Power BI report
Important notes: In order to access and use the below report, you will need a Microsoft Power BI Pro or Premium license for a Microsoft account. This can be for a work or business email.
Secondly, to gain access, please send an email to [email protected] with the subject line ‘Access to Throw-ins Overview’ from the email address that you wish to have access to the report. I will happily grant you access and reply to your email when access has been granted.
Please enjoy using the report below by clicking ‘Sign in’, and if you have any suggestions for changes, please email them to [email protected].
